Logistics simulation delivers big net working capital reductions at Sihl
News General news
Tighter product portfolio management, a structured supply chain strategy and the systematic optimization of scheduling processes have helped Sihl to reduce their net working capital significantly. On the way to this achievement, there were several hurdles to overcome.

Creative images, brilliant colors, expressive packaging – these are crucial marketing tools for many companies. Behind them are suppliers and service providers such as manufacturers of special papers, foils and fleeces. As a strong partner to future-oriented industries, Sihl creates innovative solutions leveraging high-quality coatings. More than 350 Sihl Group employees contribute to the success of customers in a wide range of industries right across the world. From automotive and tourism, packaging and labeling, to printing and logistics – customers put their trust in the German company’s premium coatings and technological know-how.
Growth and technological progress in product development led Sihl to a point where it became necessary to analyze their supply chain processes, find ways to improve them and leverage the critical competitive advantage ‘delivery time’ better. This move was triggered by a variety of different country-specific ERP systems and the associated losses.
Other factors included product availability versus inventory size, and last but not least, customer satisfaction in a fiercely competitive market where high delivery readiness and predictable delivery timing are taken for granted.
The goals: transparency, right levers and quick wins to boost motivation
“We wanted to find a way to achieve the highest possible inventory transparency and to lay the crucial foundations to address our logistics challenges,” recalls Supply Chain Manager Fabian Ossen. This led to the definition of six specific project goals: greater delivery reliability for customers; coordinated delivery strategies; simplification of value streams; reduction of variant diversity; review of item parameters for improved scheduling and forecasting; and reduction of net working capital.
It was clear to all concerned that external support was required to analyze the processes, moderate the discussions and develop suitable strategies. Quick wins were seen as a way to boost internal motivation to implement far-reaching optimization strategies more quickly and within budget.
Logistics simulation strategy seals the deal
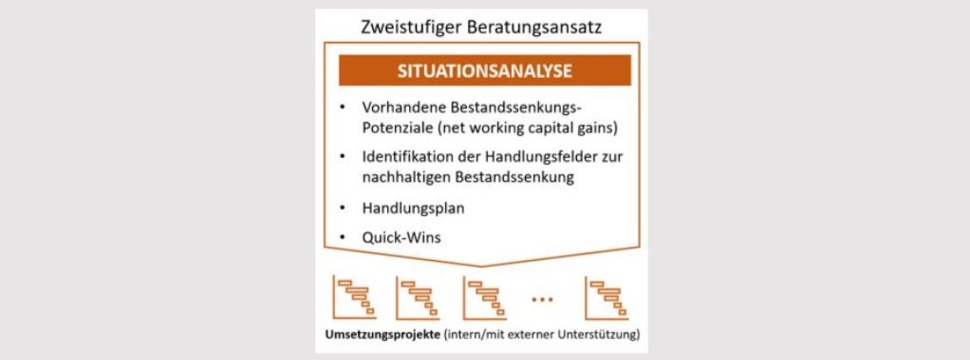
Management consultancy Abels & Kemmner was awarded the contract to support and implement the project. Their strategy to deploy a special simulation system to analyze and pinpoint areas with improvement potential was convincing. Besides including a digital twin of the ERP system, Abels & Kemmner’s two-part strategy was also about 30% cheaper than classic consulting approaches. Sihl also hoped that the digital twin would speed up the data analysis, thereby enabling faster implementation of new measures.
In this approach, the analysis of potential is divided into two main parts: process analysis and data analysis. During process analysis, all essential supply chain processes are scrutinized. During data analysis, on the other hand, detailed master and transaction data is pulled from the ERP systems and then analyzed in the deployed simulation system. As a rule, obvious improvement potential is already uncovered during process analysis and appropriate measures can be implemented directly. In Sihl’s case, the prime objective was to review the inventory strategies and item classifications.
Rapid results and lucrative quick wins
This approach allowed Sihl to uncover excessive inventories, poor availabilities and unsuitable items in the product portfolio. Decoupling point analysis, where inventory levels were determined on the basis of customer delivery promises, revealed wrong stock keeping strategies. The simulation system then calculated the necessary inventory levels on the basis of corrected strategies and used this data to determine the potential for inventory reduction, i.e. lower working capital.
Quick wins at the beginning of the collaboration contributed to a return on investment (ROI) for the consulting project. Typical quick win examples were uncoordinated processes, especially where areas of responsibility overlapped, or incorrect system parameters, e.g. for emergency stocks or batch sizes.
Employee involvement promotes acceptance
The project and operations teams were brought together in so called ‘potential’ workshops to verify and discuss the process and data analysis results in great depth. These discussions brought many details to light that had not been mentioned during earlier interviews, and mainly stemmed from personal notes and additional information that was not included in the ERP data.
These potential workshops also provided a platform to brainstorm possible solutions and test their feasibility. Involving the employees directly in the workshop and the solution finding process helped to achieve a high level of acceptance. Based on the knowledge gained during the workshop, the participants went on to become important multipliers and ambassadors of promising project ideas.
Result: a robust action plan
After gathering many suggestions and individual measures during the analysis phase, Sihl attained a coordinated action plan. The individual measures were bundled and grouped into major topic areas. The role of the project team was to support the design of measures and assess their potential. Sihl ended up with a six-pack of measures, of which three main action points stand out:
Measure 1: Product portfolio management
A bitter realization was that Sihl’s broad (many different products) and deep (many variants) product portfolio caused process and inventory costs to escalate, melting away margins. The existing product portfolio showed the typical signs of unregulated product development: As new product ideas were being implemented, old or less profitable products were not retired.
The new product portfolio management measures are designed to prevent this from happening in the future. To this end, so-called market teams were created whose task it is to regularly analyze the product portfolio, determine launch and end-of-life phases, and define successor products. A key factor for the success of this measure was the implementation of a regular process that clearly specified what had to be done and when, what parameters decisions had to be based on, and how the decision-making and escalation process worked.
Measure 2: Implementation of a structured delivery strategy
A short customer survey, conducted at the beginning of this measure, revealed that more than half of the customers surveyed were dissatisfied with the delivery service level. Customers also expected shorter delivery times for certain products. As a consequence, this measure included a review of the existing market promises and the development of a future delivery strategy based on delivery classes.
For this purpose, a set of delivery classes was defined that specified different customer delivery times. Under the new strategy, major products with a high turnover continue to be supplied from stock at short notice. However, less frequently demanded products will now be delivered within replenishment lead times. For the latter delivery classes, it is no longer necessary to stock finished and semi-finished products.
A total of five different delivery classes were defined, ranging from delivery class A with a delivery time of n days, B with n+3, C with n+7, and D with n+21 to delivery class E “on request”. This measure alone led to a total inventory reduction of over 12%.
Measure 3: Systematic optimization of scheduling
Up to now, inventory strategy decisions and the associated scheduling parameters were mainly left to the dispatchers. However, measure 2 led to the conclusion that a system was needed to specify optimal key MRP parameters in future. Such key parameters include planning strategy, forecast profile, desired delivery readiness and safety stocks, as well as MRP and lot-sizing methods.
The first task was the definition of three main item classifications: ABC for the economic importance; XYZ for the regularity of demand; and STU for the number of buying customers. Additional factors that can influence MRP parameters include product life cycle, product group, delivery time, product hierarchy, and so on.
All these factors are assimilated in an MRP rule set that defines the material parameters. This makes it possible to specific exactly and for each individual item whether to follow a make-to-stock or make-to-order strategy, and how to assign the various parameters described above. The rule set also directly affects the forecast parameters, including the required safety stock calculation parameters.
In summary, this rule set defines all parameters to ensure that the MRP part of the ERP system is optimized and the calculated potentials are achieved.
The pillars for this systematic and optimized scheduling strategy are illustrated in figure 2.
Successful cooperation continues
A significant advantage of the rule set is that it enables automation. This is particularly useful for the MRP controller, as any changes in the material parameters are automatically recognized, making manual parameter adjustment unnecessary.
As a logical consequence, Abels & Kemmner was tasked with a subproject to handle the IT-supported implementation of the rule set. This culminated in the recommendation to deploy a suitable supplementary software system, as programming in the ERP environment was found to be too costly.


